I was a sales rep working with noisy, scattered data. So I built the tool I always wanted.
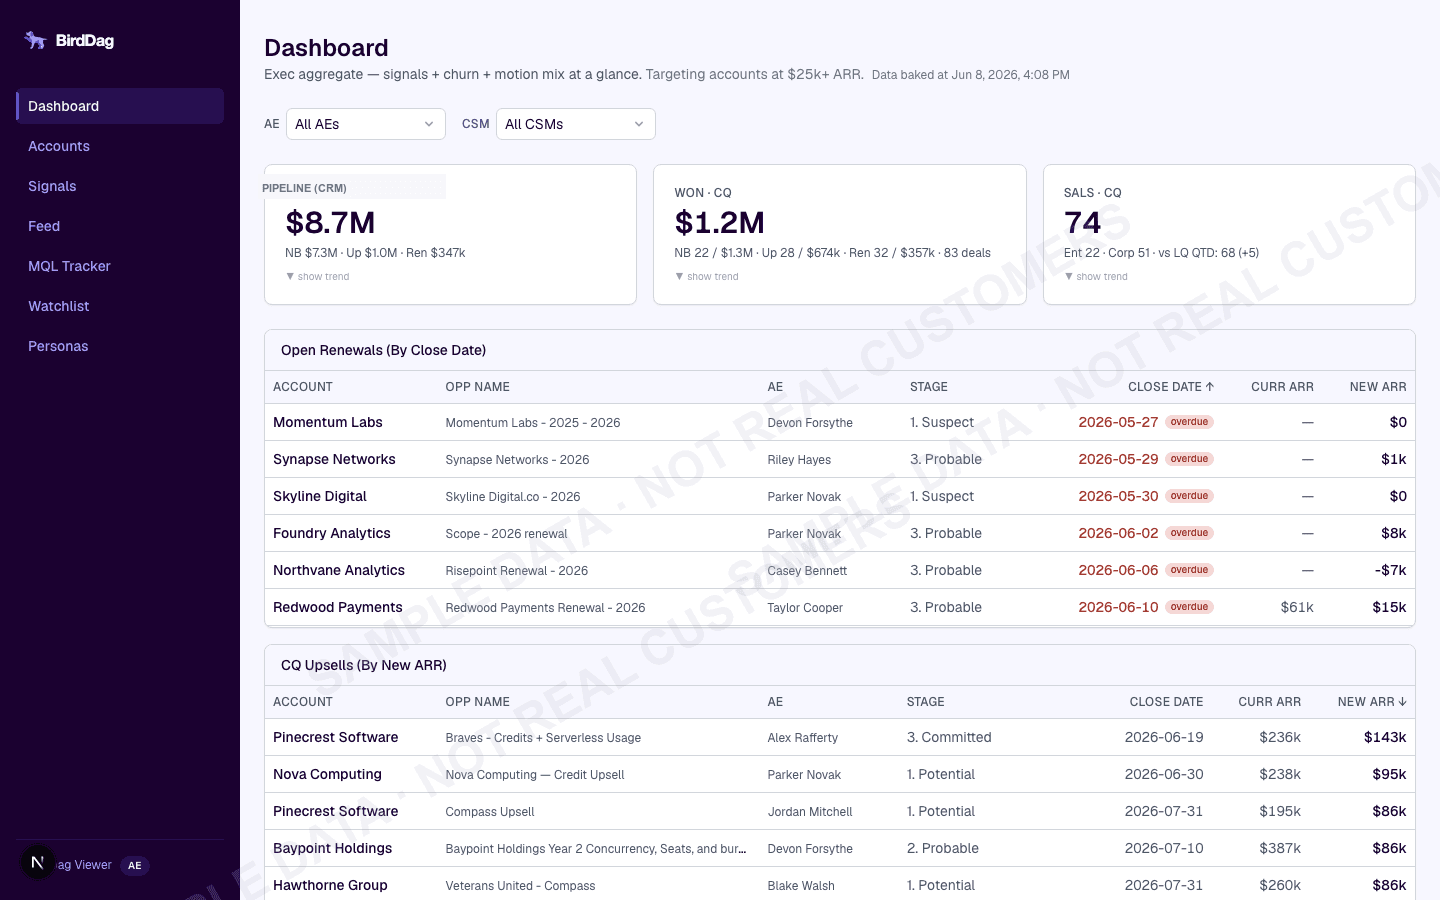
Screenshots use anonymized sample data. All company names, people, and figures are fictional.
There's a lot of noise when your data comes from a dozen systems
I've been a sales rep. I know what it's like to have customer signals coming from everywhere and context living nowhere useful. At Dagster, the data that mattered was spread across systems: product usage in the warehouse, conversations in Gong, tickets in the support tool, engagement across community platforms. It all existed, but there was no unified way to turn it into something you could act on.
A legacy internal tool existed but was broken. Nobody had rebuilt it. Reps were asking Compass (Dagster's AI assistant) questions it couldn't answer, like which accounts had deployment growth trends or which teams were ramping new workloads. The signals were in the data, but nobody was computing them.
I wanted to create centralized account intelligence that gave the team a full historical view of the companies they're speaking with. Then use that data to figure out who our best customers really are, and make sure no leads fall through the cracks.
Three problems, solved in sequence
Centralized Account Intelligence
Full historical view of every account in one place. Past Gong calls, support tickets, credit consumption changes, new feature adoption, seat growth, hiring signals, community activity. Instead of checking twelve systems, the team opens one page and sees everything that matters about a customer.
ICP & Persona Tracking
Advanced ICP modeling that correlates every person who was in a conversation with closed-won opportunities. You can see who your champions actually are, where coverage gaps exist, and which contacts have gone stale. Backed by data from CRM, community platforms, and meeting history.
MQL Recovery
We noticed MQLs were dropping off after demo no-shows and reschedules. So I built a live system that surfaces MQLs in real time as they appear, with their full engagement history and LinkedIn contact info. When an opportunity doesn't convert to a demo held after a set window, it kicks back into the queue automatically. No leads falling through cracks because someone forgot to follow up.
What powers it
Signal Detection
30+ signal types evaluated against every account, each assigned severity (P0/P1/P2) and category (expansion, churn, or mixed). Credit consumption changes, support spikes, deployment changes, contract thresholds, meeting cadence, webinar engagement, community activity, hiring signals.
LLM Expansion Scoring
An LLM classifies accounts into expansion motions with predicted ARR delta and confidence scores. The full pipeline run costs roughly a dollar for the entire book of business because I built a token budget system that caps spending per subsystem.
Health Scores
Multiple factors across product usage, technical health, strategic alignment, engagement, and expansion path. Some rules-based, others LLM-evaluated. Hard overrides for domain-specific edge cases like acquisitions or critical usage thresholds.
Slack Delivery
Monday morning DMs to each rep with priority signal accounts. Includes signal context, recommended plays, predicted ARR delta. Reps get real context they can use before their first call of the week, not just a dashboard link.
One-Click QBRs
Quarterly Business Reviews with health scores, contact roster, usage metrics, top signals. Generates shareable links. PDF export via server-side rendering. No customer login required.
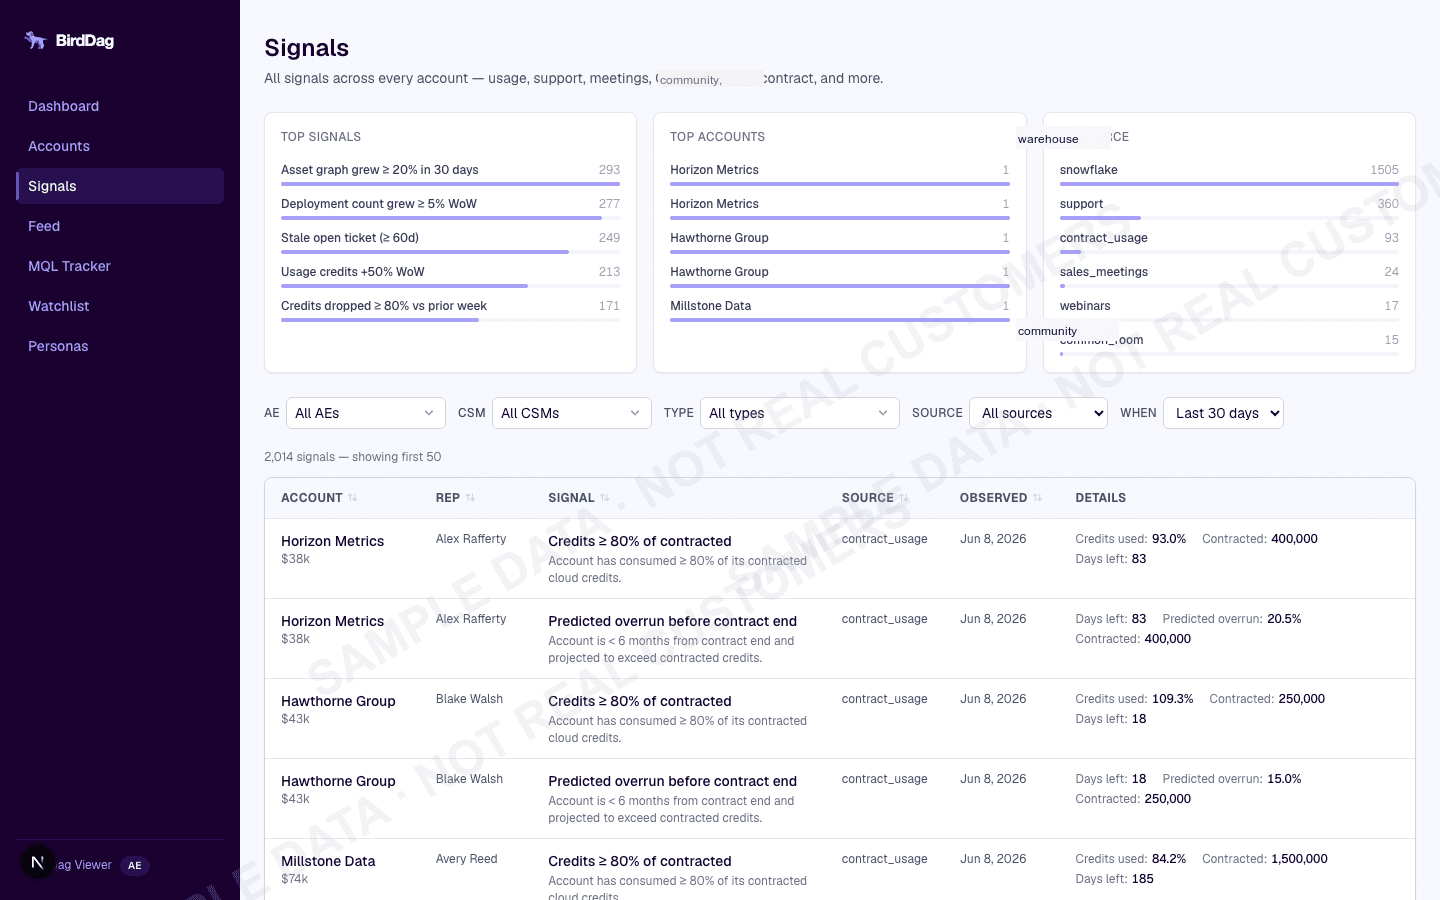
Signals view: 30+ signal types, filterable by source and time window.
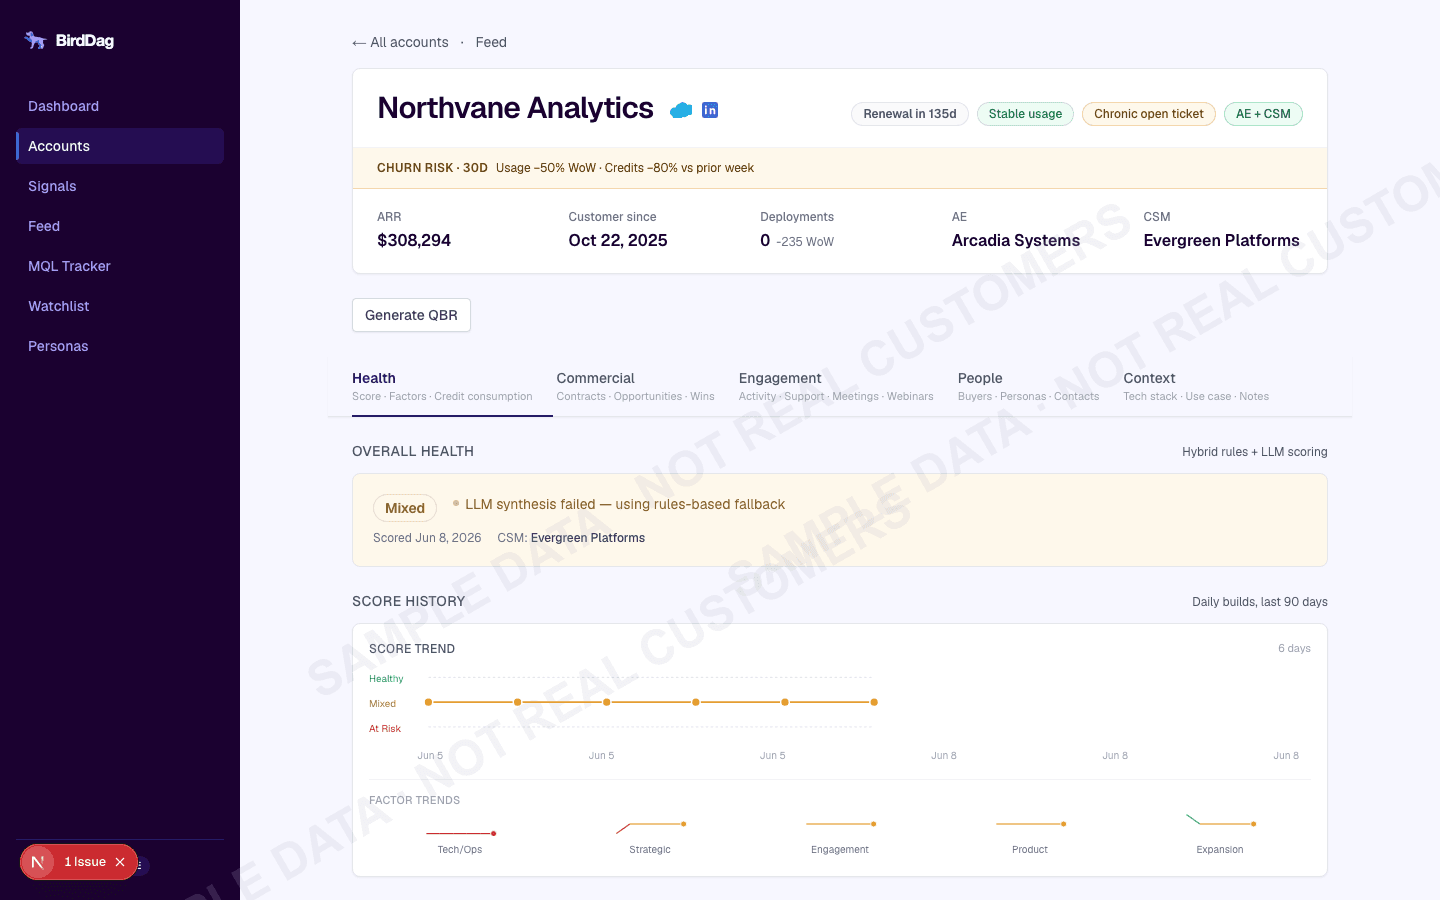
Account detail: health score, churn risk, score trend over 90 days.
Everything expensive happens at build time
The core design: a multi-cadence bake pipeline (hourly data refresh, periodic LLM scoring and persona analysis) produces all expensive computation and writes the output to object storage. Runtime reads cached results. Pages load fast. Cost is fixed and predictable.
50+ warehouse queries across 30 data modules pull from 20+ warehouse tables. Signal evaluation, LLM scoring, health computation, and persona aggregation run across hourly, daily, and weekly cadences. Output is a single data.json pushed to object storage. The Next.js app reads it with ETag-based caching. PostgreSQL handles writes (QBRs, user state). If storage is down, the app serves stale disk data.
Full Stack
Five problems that didn't have obvious answers
Keeping LLM costs from exploding
The naive version would send every account's full context to an LLM. That would cost hundreds per run. I built a token budget system with a hard cap per run. Shared context (pricing tiers, product catalog) goes in a cached prompt block. Per-account input is restricted to variable data only. If the budget runs out mid-run, it stops cleanly and reports which accounts got scored and which didn't. Primary API is the LLM provider directly, with cloud provider fallback.
Signals that fire too much are useless
Early versions had a problem: if an account's usage was growing 60% WoW for three weeks straight, the AE got three identical alerts. That's noise, not signal. I added firing granularity controls. Some signals fire daily, some weekly. If the trend continues, it doesn't re-alert. Definitions are versioned with supersede chains, so changing a threshold from 50% to 25% doesn't break historical data. Minimum 2-signal threshold before an account becomes an opportunity.
Context-blind health scores
Rules-based and LLM factors sometimes rated accounts green despite imminent churn risk. I added hard override circuit breakers: domain-specific rules that force Red ratings for special contexts. Near-ceiling usage with a short renewal window. Acquisition mid-flight. These override whatever the computed score says.
Pre-rendering hundreds of pages
Every account gets its own detail page, pre-rendered at build time with charts, timelines, signal histories, persona analysis. Default Node heap couldn't handle it. Had to significantly increase it for the SSG pass. Multi-stage Docker build: fat heap for compilation, minimal image with headless browser for PDF export. Explicit build artifact exclusions to prevent image bloat.
Signal utility vs. accuracy
Raw signals like "usage grew 60% WoW" are accurate but not actionable. Every signal now carries a "why" payload with specific context: job changes, new assets, credit burn shifts. Slack delivery provides concrete talking points, not dashboard links that require interpretation.
What the team said
“bird dag is sick”
Pete Hunt, CEO, Dagster
“This stuff is great — thank you! Just want to look into it and go an extra level deep into knowing what these things are before trying to work them into expansions.”
Austin Cinalli, Account Executive, after using Bird Dag signals to prep an expansion play
Shipped to the org in 4 weeks
27 people across sales and CS get weekly signals. Every Monday morning, each rep receives a Slack DM with their priority accounts, ranked by severity, with talking points they can use before their first call. The dashboard is there for deeper analysis, but Slack delivery is the primary product.
ICP and persona tracking now correlates every contact in a conversation with closed-won deals, so reps can see who their real champions are instead of guessing. MQLs that stall after no-shows automatically recycle back into the queue.
QBR generation went from a multi-hour manual process to one click with shareable customer-facing links. LLM costs held to roughly a dollar per full pipeline run using token budgets and a smaller, cheaper model tier for routine scoring. 580+ tests cover signal logic edge cases.
Scope Touched
Where it's going
The system is designed to scale into new business, not just existing customers. The same data concentration and trend analysis that identifies expansion opportunities in current accounts can target and qualify net-new deals. Automated data refresh via S3 bake pipeline (hourly), deeper signal coverage, and tighter feedback loops so reps can mark signals as useful or noisy directly from Slack.
Interested in a similar project?
Let's Talk